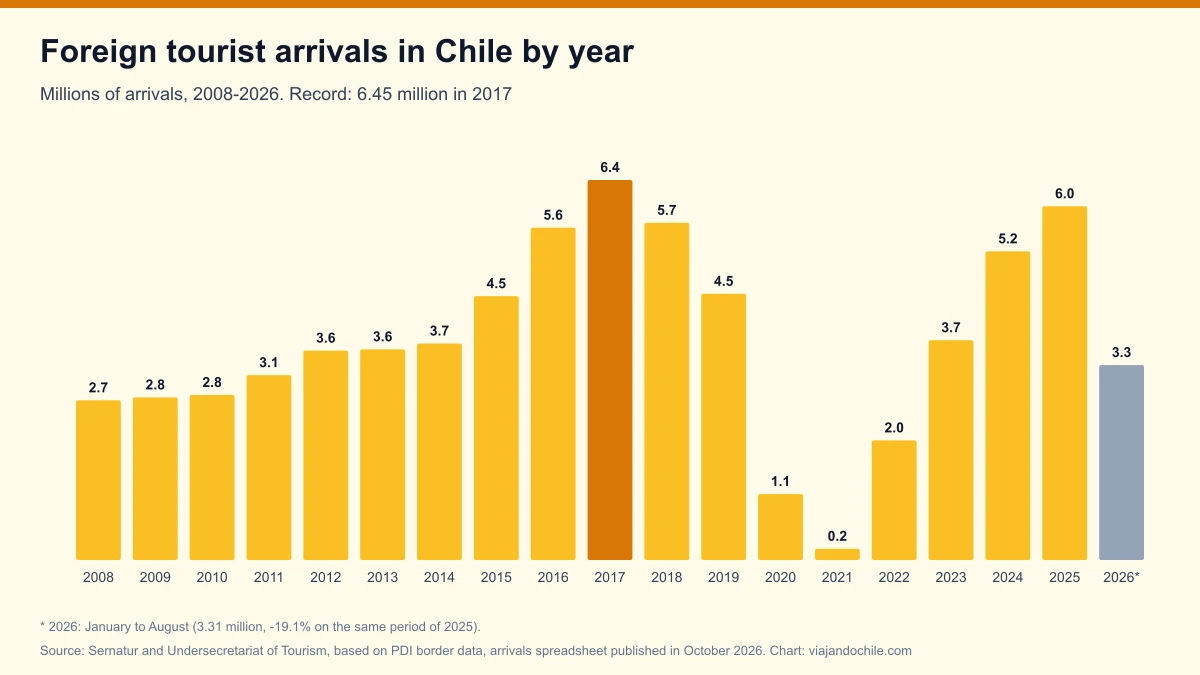
The year with the most foreign tourist arrivals in Chile was 2017, with 6,449,883, according to the official series of Sernatur and the Undersecretariat of Tourism, which starts in 2008. The second-best year was 2025, with 6,004,567 arrivals, 93% of the record. In 2026 the trend reversed: from January to August 3,308,873 tourists arrived, 19.1% fewer than in the same period of 2025, mainly because of the drop in the Argentine market.
*Updated on 24 October 2026.* The data come from the foreign tourist arrivals spreadsheet published in October 2026 by the Undersecretariat of Tourism, compiled by Sernatur from records of the Investigations Police (PDI). This page is updated every month with the new figure.
Foreign tourist arrivals in Chile by year
| Year | Arrivals | Annual change |
|---|---|---|
| 2008 | 2,710,024 | - |
| 2009 | 2,759,695 | +1.8% |
| 2010 | 2,800,637 | +1.5% |
| 2011 | 3,137,285 | +12.0% |
| 2012 | 3,554,279 | +13.3% |
| 2013 | 3,576,204 | +0.6% |
| 2014 | 3,674,391 | +2.7% |
| 2015 | 4,478,336 | +21.9% |
| 2016 | 5,640,700 | +26.0% |
| 2017 | 6,449,883 (record) | +14.3% |
| 2018 | 5,722,928 | -11.3% |
| 2019 | 4,517,962 | -21.1% |
| 2020 | 1,119,094 | -75.2% |
| 2021 | 190,022 | -83.0% |
| 2022 | 2,030,479 | +968.5% |
| 2023 | 3,730,507 | +83.7% |
| 2024 | 5,239,233 | +40.4% |
| 2025 | 6,004,567 | +14.6% |
| 2026 (January to August) | 3,308,873 | -19.1% vs. January-August 2025 |
Source: Sernatur and Undersecretariat of Tourism, foreign tourist arrivals spreadsheet (October 2026 release), sheet "Cuadro por Nacionalidad". The figures include an estimate of Chileans living abroad and exclude arrivals through seaports (cruises). They are revised up to 2015, provisional from 2016 to June 2020 and preliminary since July 2020. Changes: Viajando Chile calculation.
Why 2017 is still the record year for tourist arrivals in Chile
The 2017 record is explained by Argentina: that year 3,323,771 Argentines arrived, 51.5% of the total. In 2025 Argentines numbered 2,856,441 (47.6%) and, from January to August 2026, 1,226,678, just 37.1% of arrivals. When the exchange rate favours Argentines, they cross the Andes en masse; when it does not, Chile's overall figure suffers.
| Market | Record year | Arrivals in its record year | January-August 2026 vs. 2025 |
|---|---|---|---|
| Argentina | 2017 | 3,323,771 | -41.0% |
| Brazil | 2024 | 787,036 | +2.3% |
| Bolivia | 2025 | 562,729 | -11.0% |
| Peru | 2019 | 410,692 | +5.1% |
| United States | 2024 | 251,570 | +10.0% |
| Colombia | 2024 | 163,682 | +5.0% |
| Spain | 2019 | 86,681 | +3.7% |
| Germany | 2019 | 82,541 | +4.4% |
| China | 2025 | 42,857 | +24.1% |
| Australia | 2018 | 52,653 | +82.8% |
Source: same Sernatur and Undersecretariat of Tourism spreadsheet. Record year within the 2008-2025 series; January-August change, Viajando Chile calculation. The month-by-month detail for each country is in our ranking of foreign tourists in Chile by country.
View the data as a table
| 2016 | 2017 | 2018 | 2019 | 2020 | 2021 | 2022 | 2023 | 2024 | 2025 | |
|---|---|---|---|---|---|---|---|---|---|---|
| Argentina | 2,900,709 | 3,323,771 | 2,422,235 | 1,435,467 | 414,457 | 20,912 | 652,097 | 1,205,662 | 2,088,389 | 2,856,441 |
| Brazil | 438,915 | 544,857 | 589,172 | 542,094 | 77,872 | 13,665 | 247,190 | 485,933 | 787,036 | 681,649 |
| Bolivia | 437,154 | 479,690 | 541,294 | 467,699 | 133,426 | 3,653 | 145,676 | 347,576 | 468,681 | 562,729 |
| Peru | 403,605 | 394,204 | 388,942 | 410,692 | 97,806 | 27,257 | 183,020 | 315,752 | 365,427 | 352,353 |
| United States | 208,623 | 211,718 | 222,355 | 224,741 | 62,045 | 17,612 | 135,421 | 236,184 | 251,570 | 250,460 |
| Colombia | 119,324 | 133,341 | 132,515 | 131,818 | 32,696 | 35,903 | 124,914 | 146,369 | 163,682 | 149,592 |
| Mexico | 44,536 | 48,051 | 50,170 | 49,989 | 8,996 | 3,081 | 30,975 | 50,605 | 60,791 | 61,139 |
| China | 22,992 | 30,774 | 34,583 | 36,170 | 5,798 | 925 | 6,954 | 20,645 | 35,457 | 42,857 |
| Australia | 50,968 | 51,978 | 52,653 | 51,640 | 13,750 | 146 | 8,391 | 26,625 | 35,884 | 45,281 |

The fall and the recovery: pandemic, 2025 and 2026
The series shows three phases. First, the boom from 2015 to 2017, when arrivals grew 75% in three years. Then the fall: in 2019 they dropped to 4.5 million and in 2021, with borders closed by the pandemic, only 190,022 tourists arrived, the lowest in the series. Finally, the recovery: 2024 passed 5.2 million and 2025 ended 445,316 arrivals short of the record.
In 2026 the decline is widespread at the land crossings with Argentina, while long-haul markets grow: the United States is up 10.0%, China 24.1% and Australia 82.8% between January and August. We analysed this in the August 2026 arrivals and in the ranking of border crossings with the most tourists.
| Month | 2025 | 2026 | Change |
|---|---|---|---|
| January | 846,821 | 710,346 | -16.1% |
| February | 648,904 | 508,281 | -21.7% |
| March | 535,489 | 446,702 | -16.6% |
| April | 465,080 | 344,615 | -25.9% |
| May | 373,593 | 277,915 | -25.6% |
| June | 299,195 | 265,864 | -11.1% |
| July | 492,944 | 410,213 | -16.8% |
| August | 428,512 | 344,937 | -19.5% |
Source: Sernatur and Undersecretariat of Tourism. Preliminary figures. Change: Viajando Chile calculation.
How to read these figures
- Arrivals are not people: a tourist who enters the country twice in a year is counted twice.
- Includes Chileans living abroad: the series adds an estimate of Chileans resident abroad (213,323 in 2025).
- Excludes cruises: arrivals through seaports are excluded; the cruise season is measured separately.
- Preliminary figures: data since July 2020 may be revised under Sernatur's correction policy.
- Spending separately: how much each market spends is in our ranking of foreign tourist spending by country.
How to cite this data
Viajando Chile (2026). *Foreign tourist arrivals in Chile by year (2008-2026): the official series and the 2017 record*. With data from Sernatur and the Undersecretariat of Tourism. https://viajandochile.com/en/news/foreign-tourist-arrivals-chile-by-year-official-series
Frequently asked questions
How many foreign tourists visit Chile each year?
In 2025, 6,004,567 foreign tourists arrived, according to Sernatur and the Undersecretariat of Tourism.
Which year had the most tourists in Chile?
2017, with 6,449,883 arrivals, driven by 3.3 million Argentine tourists.
How many tourists have arrived in Chile in 2026?
3,308,873 between January and August 2026, 19.1% fewer than in the same period of 2025.